
May 2020
Typically, assessments of stock market performance are often done on discrete time periods, monthly, quarterly, annually etc. This is done for a number of reasons, standardization for easy comparisons is one. But using these timeframes can mask the actual behavior of markets, which are more volatile and less forgiving in real time than on paper.
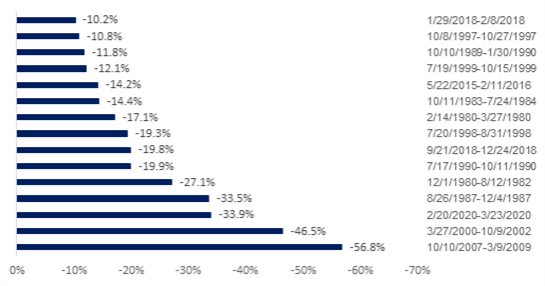
From time-to-time, markets experience drawdowns—periods of declining returns that can be short and sharp or long and deep—which cross traditional calendar periods. They can occur in the middle of a so-called bull market or across calendar divisions and thus their severity may escape the notice of some investors. Since 1980, there have been 15 drawdowns of 10% or more (eight greater than 19%). Three of these occurred in the decade prior to 2020, in the midst of a ten-year expansion.
Exhibit 1: Peak to trough S&P 500 drawdowns of 10% or greater since 1980
Drawdowns can be event-related and, like the Global Financial Crisis in 2008-9, result in a chain reaction of events over time that erodes investor confidence, further undermining the market. At the time, it may appear that there is no solution in sight to the underlying problem, so the first and only instinct is to sell. While the selling trend may initiate from a narrow sector of the market, drawdowns can end up broad-based and indiscriminate. What is important to note about drawdowns is how quickly they can erase what may have been several years of wealth accumulation in a comparatively short amount of time. For example, from 12/26/2018 to 2/19/20 the S&P 500 increased by about 40%. Then, in the course of about four weeks this past February and March, the market lost 33%, effectively erasing a year’s worth of investment performance. While the stock market has rebounded subsequently, investors who sold during this period and waited too long to reinvest may have suffered a permanent loss of capital.
Market drawdown effects can be mitigated by an effective asset allocation strategy. There are a variety for investors to choose from/implement. Some rely on mean reversion; others may choose top-down economic analysis. Most asset allocation strategies monitor portfolio exposures so that an appropriate risk-adjusted position can be adopted prior to a drawdown, or there is a prescribed response in the event of a sudden downturn. Without such a plan for unforeseen risk, investors may choose to sell into a declining market, which has its own hazards.
We know that equity markets are more volatile than bonds and other assets, so a strategy that allocates to assets with lower volatility—or better, lower correlation to stocks—would be an appropriate course ahead of a drawdown. The nature of market drawdowns is such that rational decision-making during this time period can be extremely difficult without a strategy in place. But it is always very easy to look back after the fact to determine what one should have done.
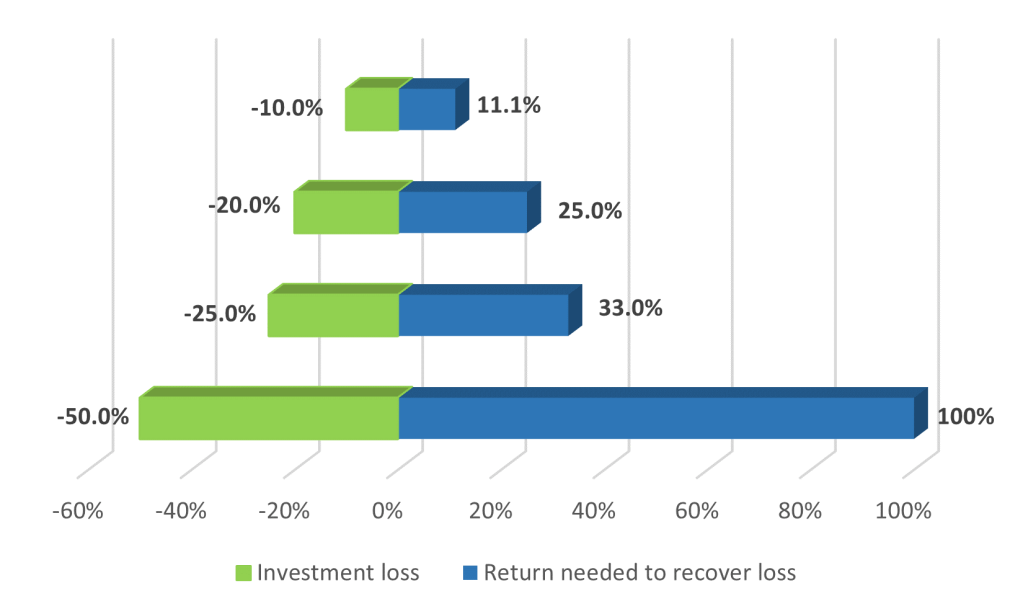
As if losing wealth were not bad enough, the mathematics of compounding makes drawdowns particularly penal. As the chart below indicates, portfolio losses require an even bigger rate of recovery on a percentage basis to make your money back. For example, a 10% loss (losing $10 on a $100 portfolio) requires an 11.1% return on the remaining $90 to get back to $100). A loss of 25% requires a subsequent return of 33% to break even, etc.
Exhibit 2: Investment loss and required breakeven recovery return
Losing money never feels good. Investors need to remind themselves that even during apparent good times the risk of major drawdowns is always there and always a threat to accumulated wealth. As shown above in Exhibit 1, since 1980 there have been 15 instances where the stock market has fallen from its peak by more than 10%—this is about every two and half years. The average of these 15 drawdowns is 23%. Being risk aware can mitigate these drawdowns and lessen the desire to increase portfolio risk unnecessarily to compensate for any loss.
While there is no sure-fire way to avoid portfolio losses, that isn’t a reason to ignore risk altogether. Unintended risk is the greatest threat to your portfolio. When comparing the benefits of different diets, i.e., monitoring fat versus carbohydrate intake, a major publication concluded that ultimately, to lose weight, “you need to count something”. The same can be applied to portfolio risk. One needs to monitor something.
Without having to resort to multi-factor risk analysis, which itself has shown to have its issues, there are several things that investors can do evaluate risk. First is to understand what the tolerance for loss is. Second, one can monitor the stock/bond/cash allocation. Stocks are more susceptible to bouts of volatility and drawdowns. While trying to time the market is not advised, a periodic review of asset allocation can keep risks in check. Knowing that stocks are more volatile than bonds, which are more volatile than cash, one can budget their risk tolerance appropriately. The third is have a plan. Market volatility appears much less pronounced when looking at the long-term versus looking at day-to-day and intra-day movements. Planning for market downturns before they happen, and possibly leaving money on the table, is much more sound than trying to time a market top. Protecting wealth is paramount to eking out the last dollar.
-Mark Kelly
May 2020
