The fragile nature of the economic growth cycle last decade dogged markets such that by 2018, there was a growing sentiment that it was close to running its course. But that mindset drove value stocks much more than growth stocks, as the well-known mega-caps continued their historic run. Companies with strong secular and visible earnings growth—that could weather a downturn—came even more into favor. This momentum would carry through the pandemic and resulting recession, further increasing the disparity.
In late 2019, I worked on a paper with the quantitative research team at my prior firm (Three Observations on Value), that examined the value/growth relationship relative to the yield curve. How has this relationship held up? That depends on how comfortable you are with rationalization and how much stock you put in interpreting charts.
Exhibit 1: Value stocks track yield curve spread
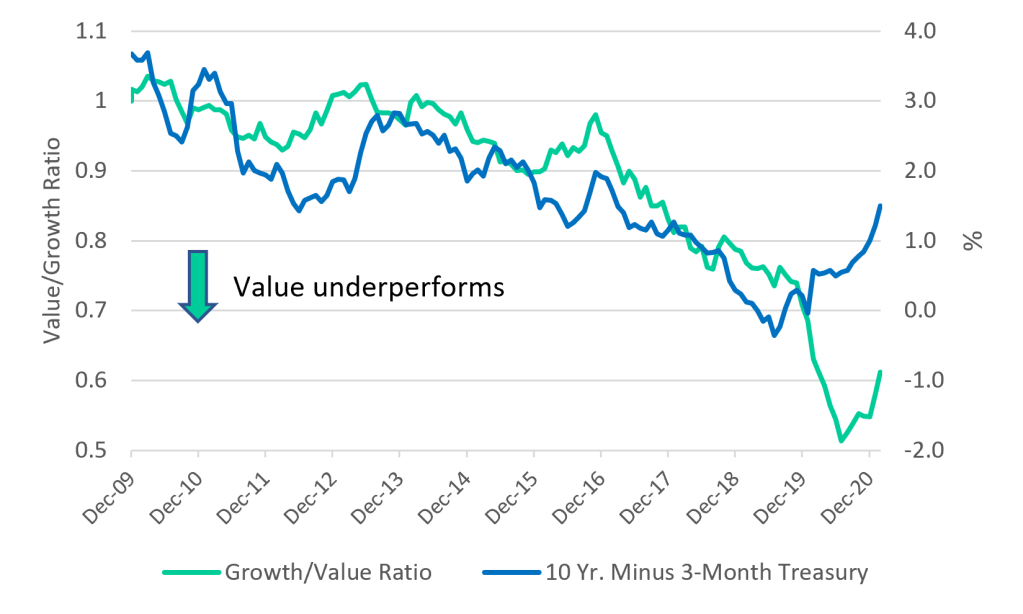
As you can see from Exhibit 1, prior to 2020, the relationship between the yield curve and the value/growth ratio was fairly strong. When the yield curve inverted in 2019—a bearish signal to many—and again in 2020, the fortunes of value stocks sunk further. When the bottom fell out of the market as the pandemic started, many companies could no longer project earnings with any confidence. The shutdown had the effect of inducing what many felt was an inevitable recession. Cyclically disposed value stocks were the hardest hit, and companies that had been strong heading into the pandemic maintained their dominance. The FAANG universe of secular growth companies were able to manage their way through the pandemic by providing essential services and could provide a clearer earnings picture, leading to a further widening of the value/growth performance dispersion.
But starting in September 2020, there was a shift in market leadership which has held through mid-March 2021. As interest rates have risen, so too have value stocks, indicating that this relationship is still holding. Rising interest rates are an indication of economic recovery, a recovery that benefits stocks at the bottom of their cycle. Fed Chair Jerome Powell has noted several times, in several forums, that the central bank is not predisposed to tighten monetary policy and will consider raising rates only when inflation exceeds its target for an extended period of time. The prospect for rising rates over the medium to long-term, driven by economic acceleration, not inflation, seems to be the current course—and the subject of market consternation. With negative yields common around the world, and historically low yields here in the U.S., deflationary forces have nipped at the global economy for the last decade. Japan is 30 years removed from its real estate collapse and the 10-year JGB yields 0.1%; the U.S., just over 10 years removed, is trying to avoid Japan’s fate. A little inflation now may be good.
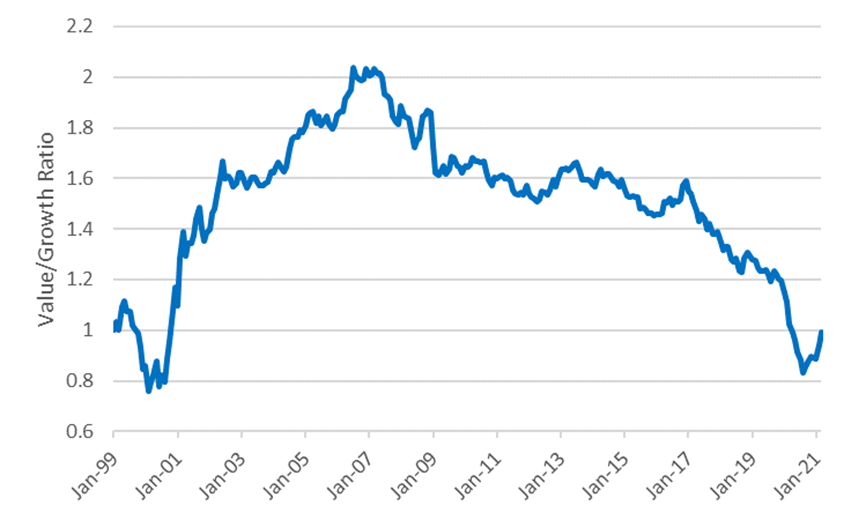
To put this in a portfolio perspective, the value/growth relationship goes in cycles. Since 1999, the Russell 1000 Value index and the Russell 1000 Growth index have performed roughly equally through mid-March. Given how short and sharp the value cycle was in the early 2000s, if you are looking to rebalance your portfolio, this may be the time to consider a value tilt.
Exhibit 2: Value vs. growth since 1999